pikesaku’s blog

個人的な勉強メモです。記載内容について一切の責任は持ちません。

AWS S3調査メモ

メモ

S3はクラウドストレージ
データをオブジェクトとして扱う
オブジェクトはファイル自体とメタデータで構成
オブジェクトの入れ物はバケット
バケットにアクセス制御・保存場所のRegion指定が可能
バケット名は一意である必要あり
バケット名はオブジェクトにアクセスするURLに含まれる
バケット名は作成後に変更できない
バケットにオブジェクトを格納する時、バケットから別のバケットにデータを転送する時に費用発生
ライフサイクル管理、バージョニング機能もあり
以下の量に応じて課金される
 ・ストレージ利用量
 ・リクエスト数
 ・利用機能(ストレージマネジメント)
  例) Inventoryの場合、リストアップされるオブジェクト数に応じて
 ・データ転送量
 詳細は以下URL参照
 料金 - Amazon S3(クラウドストレージ)|AWS
開発・リファレンスリソース
 開発リソース - Amazon Simple Storage Service
 リファレンスリソース - Amazon Simple Storage Service

実践!

AWSマネジメントコンソールから

f:id:pikesaku:20181104080023p:plain
f:id:pikesaku:20181104080036p:plain
f:id:pikesaku:20181104080045p:plain
f:id:pikesaku:20181104080101p:plain
f:id:pikesaku:20181104080108p:plain
f:id:pikesaku:20181104080114p:plain
f:id:pikesaku:20181104080123p:plain
f:id:pikesaku:20181104080133p:plain
f:id:pikesaku:20181104080143p:plain

ログ画像化(図表示)

コード

apache_log_trans_to_image.py

# -*- coding:utf-8 -*-
import argparse
import apache_log_trans_to_image_lib as alti

parser = argparse.ArgumentParser(description='apache log to graph')
parser.add_argument('log', help='log file', type=argparse.FileType('r'))
parser.add_argument('--unit', help='unit of urls', type=int, default=2)
args = parser.parse_args()


if __name__ == '__main__':
    data = alti.get_data(args.log, args.unit)
    data = alti.change_data_for_graph(data)
    alti.output_graph(data, args.unit)

apache_log_trans_to_image_lib.py

# -*- coding:utf-8 -*-


def get_data(log, unit):
    import apache_log_parser
    import itertools

    def chk_key(line):
        required_key = ('request_url_path', 'remote_host')
        for key in required_key:
            if not key in line:
                return False
        return True

    def chk_ext(line):
        request_url_path = line['request_url_path']
        except_ext = ('gif', 'jpg', 'png', 'ico', 'css', 'js', 'woff', 'ttf', 'svg')
        ext = request_url_path.split('.')[-1].lower()
        if ext in except_ext:
            return False
        return True

    data = dict()
    parser = apache_log_parser.make_parser('%h %l %u %t \"%r\" %>s %b \"%{Referer}i\" \"%{User-Agent}i\"')

    for line in log:
        line = line.strip()
        line = parser(line)
        if not chk_key(line):
            continue
        if not chk_ext(line):
            continue
        host = line['remote_host']
        request_url_path = line['request_url_path']
        if host in data:
            data[host].append(request_url_path)
        else:
            data[host] = [request_url_path]

    for host,request_url_path_list in data.items():
        request_url_path_list = list(itertools.zip_longest(*[iter(request_url_path_list)]*unit))
        request_url_path_list[-1] = [request_url_path for request_url_path in request_url_path_list[-1] if request_url_path is not None]
        data[host] = request_url_path_list

    return data


def change_data_for_graph(data):
    changed_data = dict()
    for host,request_url_path_list in data.items():
        units_of_nums = list()
        for part in request_url_path_list:
            units_of_nums.append([trans_str_to_num(url) for url in part])
        changed_data[host] = units_of_nums
    return changed_data


def trans_str_to_num(s):
    import hashlib
    import re
    s = s.encode('UTF-8')
    m = hashlib.md5()
    m.update(s)
    h = m.hexdigest()
    # hは16進数32桁
    # 4桁づつ、リストにする。
    # https://stackoverflow.com/questions/13673060/split-string-into-strings-by-length
    nums = [ int(i, 16) for i in re.split('(.{4})', h)[1::2] ]
    return nums


def output_graph(data, unit):
    import matplotlib.pyplot as plt
    import numpy as np
    from matplotlib.ticker import MultipleLocator, FormatStrFormatter
    import math

    majorLocator = MultipleLocator(20000)
    majorFormatter = FormatStrFormatter('%d')
    minorLocator = MultipleLocator(4000)

    def fillplot(x, y, pos, fig):
        # http://nihaoshijie.hatenadiary.jp/entry/2017/12/19/013413
        # https://www.mathpython.com/ja/python-number-pow/
        # https://hibiki-press.tech/learn_prog/python/round_ceil_floor/903
        w = h = math.ceil(pow(unit, 1 / 2))
        ax = fig.add_subplot(w, h, pos)
        ax.xaxis.set_major_locator(majorLocator)
        ax.xaxis.set_major_formatter(majorFormatter)
        ax.xaxis.set_minor_locator(minorLocator)
        ax.yaxis.set_major_locator(majorLocator)
        ax.yaxis.set_major_formatter(majorFormatter)
        ax.yaxis.set_minor_locator(minorLocator)
        ax.grid(which='both')
        ax.grid(which='minor', alpha=0.2)
        ax.grid(which='major', alpha=0.8)
        # 目盛の数字を表示する時は以下をコメントアウト
        plt.yticks(color='None')
        plt.xticks(color='None')
        #
        plt.xlim([-65535, 65535])
        plt.ylim([-65535, 65535])
        ax.fill(x, y, color='r')

    for ip,units_of_nums in data.items():
        f_seq = 0
        for unit_of_nums in units_of_nums:
            g_seq = 0
            fig = plt.figure(figsize=(8, 8))
            for nums in unit_of_nums:
                x = list()
                y = list()

                # 右上
                x.append(nums[0])
                y.append(nums[1])

                # 右下
                x.append(nums[2])
                y.append(-nums[3])

                # 左下
                x.append(-nums[4])
                y.append(-nums[5])

                # 左上
                x.append(-nums[6])
                y.append(nums[7])

                fillplot(x, y, g_seq + 1, fig)
                g_seq += 1
            f_seq += 1
            plt.savefig(ip + '_' + str(f_seq) + '.png')
            plt.close()
            #plt.show()

アウトプット

--unit 16の場合

192.168.56.1_1.png
f:id:pikesaku:20181015010604p:plain

--unit 10の場合

192.168.56.1_1.png
f:id:pikesaku:20181023070126p:plain

ピクセルデータを指定した画像作成方法

サンプルコード(参考URLまるまる利用)

# -*- coding:utf-8 -*-

import matplotlib.pyplot as plt
import PIL
import numpy as np

img_rgb = np.array([
                    [[255,0,0],[0,255,0],[0,0,255]],
                    [[255,255,0],[0,255,255],[255,0,255]],
                    [[0,0,0],[127,127,127],[255,255,255]],
], dtype = np.uint8)

#画像の表示
#plt.imshow(img_rgb, cmap = 'gray', vmin = 0, vmax = 255, interpolation = 'none')
plt.imshow(img_rgb, interpolation = 'none')

plt.show()

アウトプット

f:id:pikesaku:20181014222120p:plain

GPFS調査メモ

わかったこと


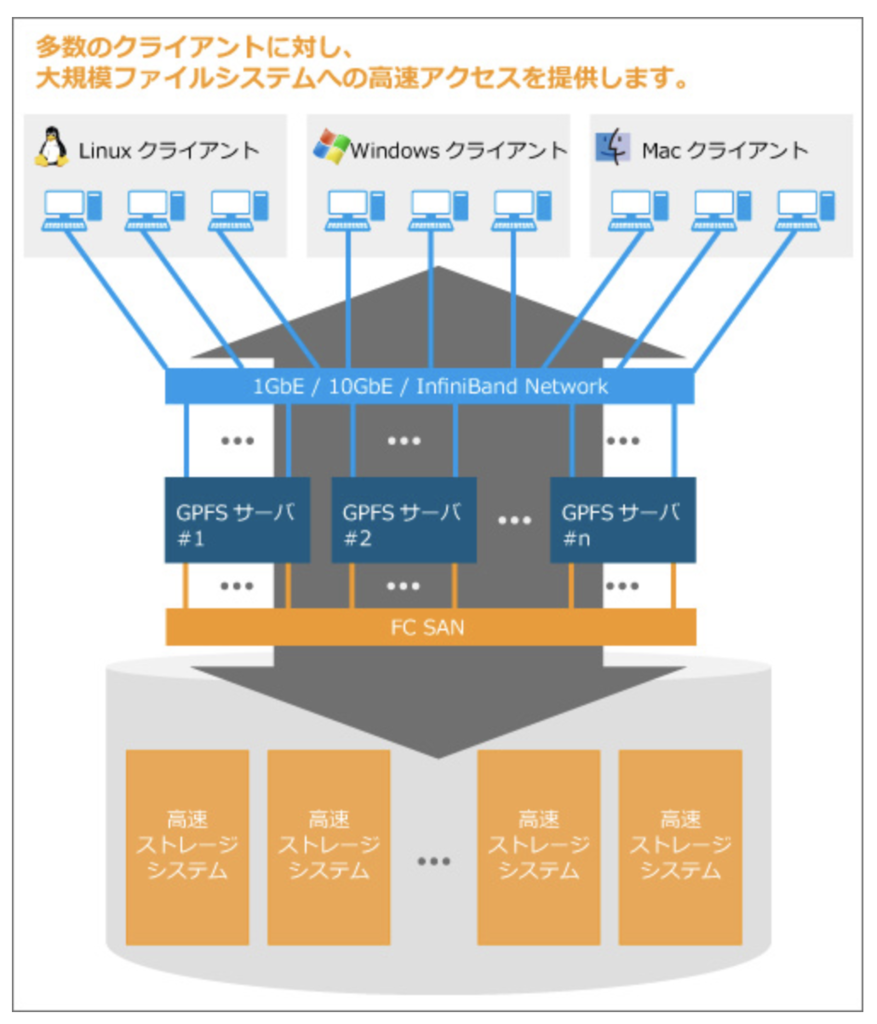
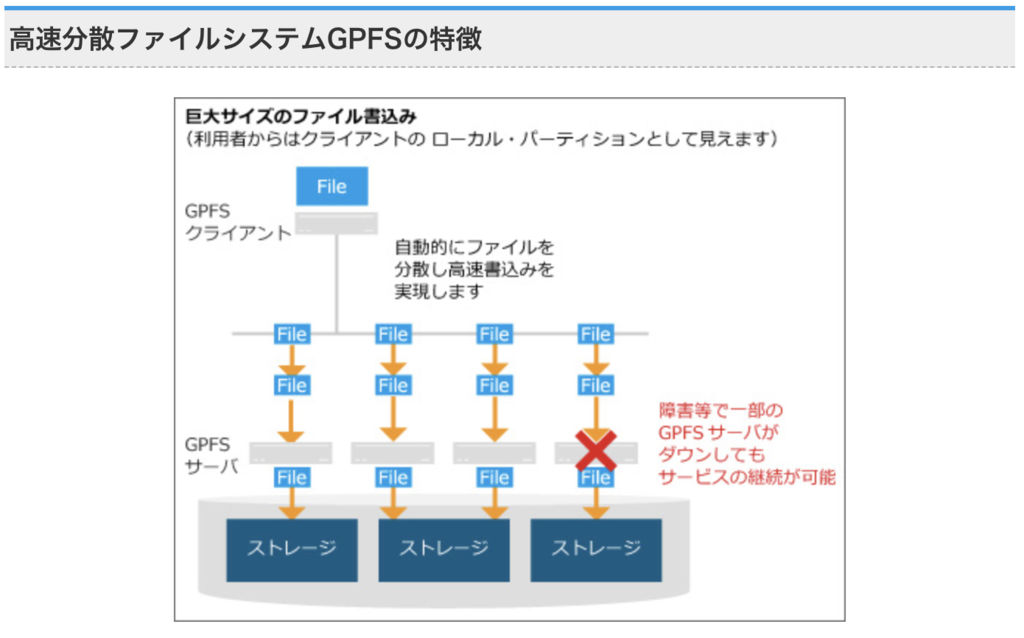
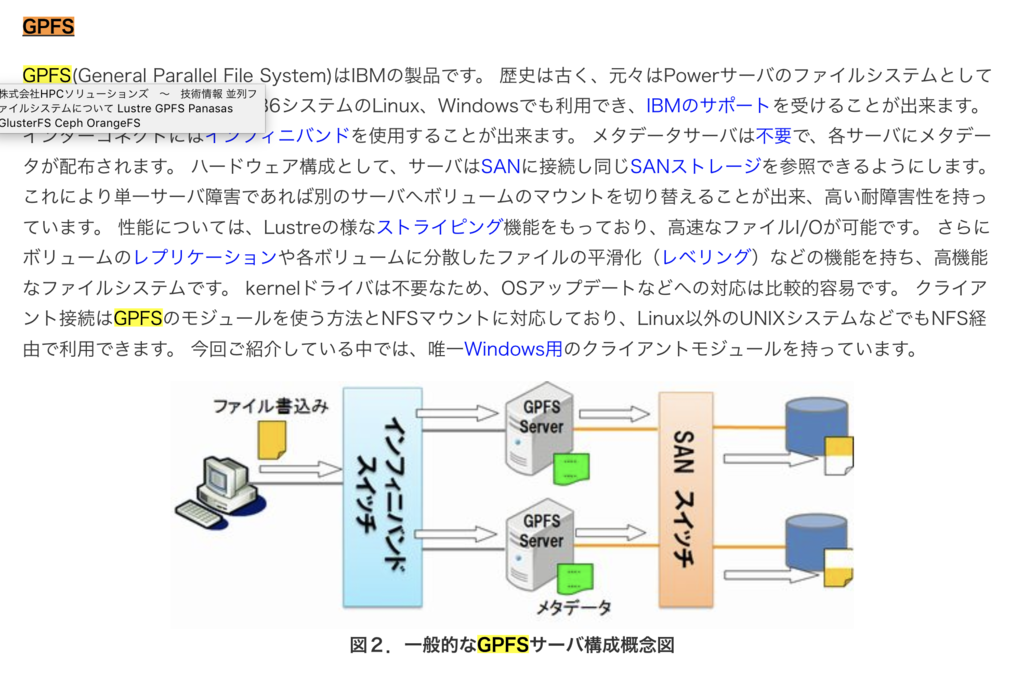
  • 分散ファイルシステム
  • GPFSクライアント利用時、クライアントにはローカルファイルシステムとして見える
  • NFSでアクセスも可能
  • スナップショット機能あり
  • 構成サーバはSANストレージを共有する
  • 複数プロセスからの同時アクセス可能
  • データストライピングを以下で実現
    • 大きなファイルを複数の同じサイズのブロックに分割して保存
    • 一つのブロックは256k(設定によって16kから1M)
    • 分散されたディスクからデータを並列にプリフェッチしてバッファに蓄積
    • Dirtyデータ書き込みも並列で実現
    • データのレプリカ保持でデータ保護
  • 同期・一貫性でPOSIXセマンティックスを保証。分散ロックで実現。
    • 同時に同じファイルにアクセスする2つプロセスが存在するとき、読み込み側のプロセスが見えるデータは書き込みプロセスが書き込んだデータのすべて、若しくはまったく見えないかのどちらか
    • 読み込みプロセスはデータが中途まで書き込まれた状態を読み込んでしまうことはない
    • ファイルシステムノードのうち一台がグローバルロックマネージャの役割をはたし、各々のノードはローカルロックマネージャを持つ
    • グローバルロックマネージャはロックトークンを付与してローカルロックマネージャ間を調整
    • 一つのノードが繰り返し同じファイルにアクセスする時は初めの一回だけロックトークンを獲得すれば、その後ノード間でメッセージ交換をする必要がない。
    • 他のノードが同じファイルにアクセスする場合は最初にロックトークンを獲得したノードにロックトークンを要求する。
    • ロックトークンを通さなければファイルのデータを変更できない。→ロックトークンは更にキャッシュの一貫性を保証する役割も果たす
  • コンポーネントはActive/Active構成


Matplotlib勉強

ソース

# -*- coding:utf-8 -*-

import matplotlib.pyplot as plt
import numpy as np
from matplotlib.ticker import MultipleLocator, FormatStrFormatter

x = [-50, 50, 50, -50]
y = [50, 50, -50, -50]

# http://ailaby.com/matplotlib_fig/
# subplot(行数, 列数, プロット番号)
# figは画像ファイル定義、axは画像の中のグラフの定義
# http://d.hatena.ne.jp/nishiohirokazu/20111121/1321849806
# https://matplotlib.org/examples/pylab_examples/major_minor_demo1.html

fig = plt.figure(figsize=(8, 8))
majorLocator = MultipleLocator(20)
majorFormatter = FormatStrFormatter('%d')
minorLocator = MultipleLocator(5)

def fillplot(x, y, pos):
    ax = fig.add_subplot(2, 2, pos)
    ax.xaxis.set_major_locator(majorLocator)
    ax.xaxis.set_major_formatter(majorFormatter)
    ax.xaxis.set_minor_locator(minorLocator)

    ax.yaxis.set_major_locator(majorLocator)
    ax.yaxis.set_major_formatter(majorFormatter)
    ax.yaxis.set_minor_locator(minorLocator)

    ax.grid(which='both')
    ax.grid(which='minor', alpha=0.2)
    ax.grid(which='major', alpha=0.8)

    # 目盛の数字を表示する時は以下をコメントアウト
    plt.yticks(color='None')
    plt.xticks(color='None')
    #

    plt.xlim([-100, 100])
    plt.ylim([-100, 100])
    ax.fill(x, y, color='r')


for i in range(4):
  print(i)
  fillplot(x, y, i + 1)

plt.show()

アウトプット

f:id:pikesaku:20181007113033p:plain

文字列をグラフ化

ソース

# -*- coding:utf-8 -*-

import hashlib
import re
import itertools
import numpy as np
import matplotlib.pyplot as plt


# グラフ化する文字列の数
UNIT_OF_SECTION = 5


def trans_to_nums(s):
    s = s.encode('UTF-8')
    m = hashlib.md5()
    m.update(s)
    h = m.hexdigest()
    # hは16進数32桁
    # 4桁づつ、リストにする。
    # https://stackoverflow.com/questions/13673060/split-string-into-strings-by-length
    nums = [ int(i, 16) for i in re.split('(.{4})', h)[1::2] ]
    return nums


def get_strings():
    strings = [
        'hoge1',
        'hoge2',
        'hoge3',
        'hoge4',
        'hoge5',
        'fuga1',
        'fuga2',
        'fuga3',
        'fuga4',
        'piyo1',
        'piyo2',
        'piyo3'
    ]
    return strings


def get_data():
    all_strings = get_strings()
    all_strings = itertools.zip_longest(*[iter(all_strings)]*UNIT_OF_SECTION)
    data = list()
    for section_strings in all_strings:
        section_data = list()
        for s in section_strings:
            if s:
                section_data.extend(trans_to_nums(s))
        data.append(section_data)
    return data


def output_graph(data):
    # https://stackoverflow.com/questions/24943991/change-grid-interval-and-specify-tick-labels-in-matplotlib
    for d in data:
        x, y = (range(len(d)), d)
        fig, ax = plt.subplots()
        major_xticks = np.arange(0, UNIT_OF_SECTION*8+1, 8)
        minor_xticks = np.arange(0, UNIT_OF_SECTION*8+1, 1)
        major_yticks = np.arange(0, 65535+1, (65535+1)/5)
        minor_yticks = np.arange(0, 65535+1, (65535+1)/5/5)

        ax.set_xticks(major_xticks)
        ax.set_xticks(minor_xticks, minor=True)
        ax.set_yticks(major_yticks)
        ax.set_yticks(minor_yticks, minor=True)

        ax.grid(which='both')
        ax.grid(which='minor', alpha=0.2)
        ax.grid(which='major', alpha=0.8)

        plt.plot(x, y)
        plt.xlim([0, UNIT_OF_SECTION*8])
        plt.ylim([0, 65535])
        plt.show()


def main():
    data = get_data()
    output_graph(data)


main()


アウトプット

1〜5個目までの文字列の画像化
f:id:pikesaku:20180902131935p:plain
 
6〜10個目までの文字列の画像化 
f:id:pikesaku:20180902131940p:plain
 
11〜13個目までの文字列の画像化
f:id:pikesaku:20180902131944p:plain

Pythonリスト扱い時のメモリ・処理速度調査

わかったこと

 
内包表記の方が処理が速い
ファイルハンドラを作成しただけではメモリは確保されない。
ファイルハンドラをフィルタせず不要にリストオブジェクトに代入しないこと
※全データ分メモリがとられる。フィルタすればフィルタ結果の分だけメモリが使われる。
forループはイテレータで動作する。ファイルハンドラをreadlinesしたり、リスト代入すると、全データ分メモリが取られる。
リスト内包表記の方が処理が速い。
 

環境準備

Python 2.7.5
 

yum install python-devel gcc
pip install memory_profiler


調査スクリプト

# -*- coding:utf-8 -*-

import subprocess
import time
import os
from memory_profiler import profile


def get_rss():
  pid = os.getpid()
  cmd = 'ps -p ' + str(pid) + ' -o rss --no-header'
  rss = int(subprocess.check_output(cmd, shell=True))
  return rss


def clear_cache():
  cmd = "echo '3' > /proc/sys/vm/drop_caches"
  subprocess.call(cmd, shell=True)


def get_perf_info(obj): 
  obj_name = obj.__name__
  clear_cache()
  start = time.time()
  pre = get_rss()
  ret = obj()
  aft = get_rss()
  leak = aft - pre
  etime = round(time.time() - start, 2)

  mes =  'Obj: {:<10}'.format(obj_name) + ' '     
  mes += 'Etime: {:>5}'.format(str(etime)) + ' '     
  mes += 'MemUsed Pre(kb): {:<10}'.format(str(pre))
  mes += 'MemUsed Aft(kb): {:<10}'.format(str(aft))
  mes += 'Mem Leak(kb): {:<10}'.format(str(leak))
  del ret
  print(mes)
  print('\n\n')


@profile
def list_op1():
  fh = open('/tmp/5.mbfile', 'r')
  fh.close()


@profile
def list_op2():
  fh = open('/tmp/5.mbfile', 'r')
  a = list(fh)
  fh.close()


@profile
def list_op3():
  fh = open('/tmp/5.mbfile', 'r')
  a = list(fh)
  aa = a[0]
  fh.close()


@profile
def list_op4():
  fh = open('/tmp/5.mbfile', 'r')
  a = list(fh)
  aa = a[0]
  del aa
  del a
  fh.close()


@profile
def list_op5():
  fh = open('/tmp/5.mbfile', 'r')
  a = [ i for i in fh ]
  fh.close()


@profile
def list_op6():
  fh = open('/tmp/5.mbfile', 'r')
  a = list()
  for i in fh:
    a.append(i)
  fh.close()


@profile
def list_op7():
  fh = open('/tmp/5.mbfile', 'r')
  a = [ i for i in fh if 'a' in i]
  fh.close()


@profile
def list_op8():
  fh = open('/tmp/5.mbfile', 'r')
  a = list()
  for i in fh:
    if 'a' in i:
      a.append(i)
  fh.close()


@profile
def list_op9():
  fh = open('/tmp/5.mbfile', 'r')
  a = list()
  for i in fh.readlines():
    if 'a' in i:
      a.append(i)
  fh.close()


get_perf_info(list_op1)
get_perf_info(list_op2)
get_perf_info(list_op3)
get_perf_info(list_op4)
get_perf_info(list_op5)
get_perf_info(list_op6)
get_perf_info(list_op7)
get_perf_info(list_op8)
get_perf_info(list_op9)

実行結果

Filename: ./a.py

Line #    Mem usage    Increment   Line Contents
================================================
    41     10.4 MiB     10.4 MiB   @profile
    42                             def list_op1():
    43     10.4 MiB      0.0 MiB     fh = open('/tmp/5.mbfile', 'r')
    44     10.4 MiB      0.0 MiB     fh.close()


Obj: list_op1   Etime:  0.07 MemUsed Pre(kb): 10636     MemUsed Aft(kb): 10740     Mem Leak(kb): 104       


Filename: ./a.py

Line #    Mem usage    Increment   Line Contents
================================================
    47     10.5 MiB     10.5 MiB   @profile
    48                             def list_op2():
    49     10.5 MiB      0.0 MiB     fh = open('/tmp/5.mbfile', 'r')
    50     19.5 MiB      9.0 MiB     a = list(fh)
    51     19.5 MiB     -0.0 MiB     fh.close()


Obj: list_op2   Etime:  0.05 MemUsed Pre(kb): 10740     MemUsed Aft(kb): 11060     Mem Leak(kb): 320       


Filename: ./a.py

Line #    Mem usage    Increment   Line Contents
================================================
    54     10.8 MiB     10.8 MiB   @profile
    55                             def list_op3():
    56     10.8 MiB      0.0 MiB     fh = open('/tmp/5.mbfile', 'r')
    57     19.4 MiB      8.6 MiB     a = list(fh)
    58     19.4 MiB      0.0 MiB     aa = a[0]
    59     19.4 MiB     -0.0 MiB     fh.close()


Obj: list_op3   Etime:  0.06 MemUsed Pre(kb): 11060     MemUsed Aft(kb): 11568     Mem Leak(kb): 508       


Filename: ./a.py

Line #    Mem usage    Increment   Line Contents
================================================
    62     11.3 MiB     11.3 MiB   @profile
    63                             def list_op4():
    64     11.3 MiB      0.0 MiB     fh = open('/tmp/5.mbfile', 'r')
    65     19.4 MiB      8.1 MiB     a = list(fh)
    66     19.4 MiB      0.0 MiB     aa = a[0]
    67     19.4 MiB      0.0 MiB     del aa
    68     11.3 MiB     -8.1 MiB     del a
    69     11.3 MiB     -0.0 MiB     fh.close()


Obj: list_op4   Etime:  0.06 MemUsed Pre(kb): 11568     MemUsed Aft(kb): 11568     Mem Leak(kb): 0         


Filename: ./a.py

Line #    Mem usage    Increment   Line Contents
================================================
    72     11.3 MiB     11.3 MiB   @profile
    73                             def list_op5():
    74     11.3 MiB      0.0 MiB     fh = open('/tmp/5.mbfile', 'r')
    75     19.4 MiB      8.1 MiB     a = [ i for i in fh ]
    76     19.4 MiB     -0.0 MiB     fh.close()


Obj: list_op5   Etime:   7.4 MemUsed Pre(kb): 11568     MemUsed Aft(kb): 11576     Mem Leak(kb): 8         


Filename: ./a.py

Line #    Mem usage    Increment   Line Contents
================================================
    79     11.3 MiB     11.3 MiB   @profile
    80                             def list_op6():
    81     11.3 MiB      0.0 MiB     fh = open('/tmp/5.mbfile', 'r')
    82     11.3 MiB      0.0 MiB     a = list()
    83     19.4 MiB      8.1 MiB     for i in fh:
    84     19.4 MiB      0.0 MiB       a.append(i)
    85     19.4 MiB     -0.0 MiB     fh.close()


Obj: list_op6   Etime: 14.78 MemUsed Pre(kb): 11576     MemUsed Aft(kb): 11576     Mem Leak(kb): 0         


Filename: ./a.py

Line #    Mem usage    Increment   Line Contents
================================================
    88     11.3 MiB     11.3 MiB   @profile
    89                             def list_op7():
    90     11.3 MiB      0.0 MiB     fh = open('/tmp/5.mbfile', 'r')
    91     16.4 MiB      5.1 MiB     a = [ i for i in fh if 'a' in i]
    92     16.4 MiB     -0.0 MiB     fh.close()


Obj: list_op7   Etime:  7.91 MemUsed Pre(kb): 11576     MemUsed Aft(kb): 11576     Mem Leak(kb): 0         


Filename: ./a.py

Line #    Mem usage    Increment   Line Contents
================================================
    95     11.3 MiB     11.3 MiB   @profile
    96                             def list_op8():
    97     11.3 MiB      0.0 MiB     fh = open('/tmp/5.mbfile', 'r')
    98     11.3 MiB      0.0 MiB     a = list()
    99     16.4 MiB      5.1 MiB     for i in fh:
   100     16.4 MiB     -0.0 MiB       if 'a' in i:
   101     16.4 MiB     -0.0 MiB         a.append(i)
   102     16.4 MiB     -0.0 MiB     fh.close()


Obj: list_op8   Etime: 19.56 MemUsed Pre(kb): 11576     MemUsed Aft(kb): 11576     Mem Leak(kb): 0         


Filename: ./a.py

Line #    Mem usage    Increment   Line Contents
================================================
   105     11.3 MiB     11.3 MiB   @profile
   106                             def list_op9():
   107     11.3 MiB      0.0 MiB     fh = open('/tmp/5.mbfile', 'r')
   108     11.3 MiB      0.0 MiB     a = list()
   109     19.8 MiB      8.1 MiB     for i in fh.readlines():
   110     19.8 MiB      0.0 MiB       if 'a' in i:
   111     19.8 MiB      0.4 MiB         a.append(i)
   112     19.8 MiB     -0.0 MiB     fh.close()


Obj: list_op9   Etime: 19.26 MemUsed Pre(kb): 11576     MemUsed Aft(kb): 11040     Mem Leak(kb): -536